
Blog
UPDATED: July 2025. Interesting eCommerce Stats I’ve Been Tracking Since 2007!
If, like me, you are an eCommerce marketer, you use and like collecting interesting eCommerce stats. That’s because stats help form benchmarks against which to measure. They also help build a case when selling an idea internally or externally.
But collecting eCommerce statistics is time-consuming and, let’s face it, a bit of a pain. They’re constantly changing, and it’s hard to keep up to date with the most current, interesting eCommerce stats.
So we collected them for you. So you don’t have to waste half a day swept into the giant time suck of endless surfing.
Here Are the Stats We’re Keeping Track of for You:
- Interesting Ecommerce Stats for the Overall Market
- Ecommerce Stats: Site Metrics
- Even More Site Metric Stats
- Interesting Ecommerce Stats for the Product Page Sales Pitch
- Storytelling
- Video
- Email Marketing
- Interesting Stats About Ecommerce Product Reviews
- Investment in Conversion Rate Optimization (CRO)
- Interesting Stats About the Impact of Visuals on Ecommerce
- Buyer Psychology
- Google Search
- Interesting Mobile Ecommerce Stats
- Interesting Amazon Ecommerce Stats
- Live Chat
Interesting Ecommerce Stats for the Overall Market
— The consumer packaged goods (CPG) market is bursting with new products. Incredibly, close to 30,000 new products launch each year. (Source)
Ecommerce Stats: Site Metrics
— In 2020, Wolfgang Digital analyzed 130 million eCommerce site sessions and calculated the average session duration (time on site) to be 2 minutes 32 seconds (source).
To put this in perspective, their 2019 report calculated the average session duration to be 3 minutes 1 second.
This means the average time on site is going down year over year.
— In contrast, the top 100 global shopping websites in 2021 had an average visit duration of about 6 minutes 47 seconds. Source.
— In the same 2020 Wolfgang Digital report, they also noted that the average bounce rate for a retail eCommerce site is 41%.
— The average 🇺🇸 user visits 130 web pages per day (source).
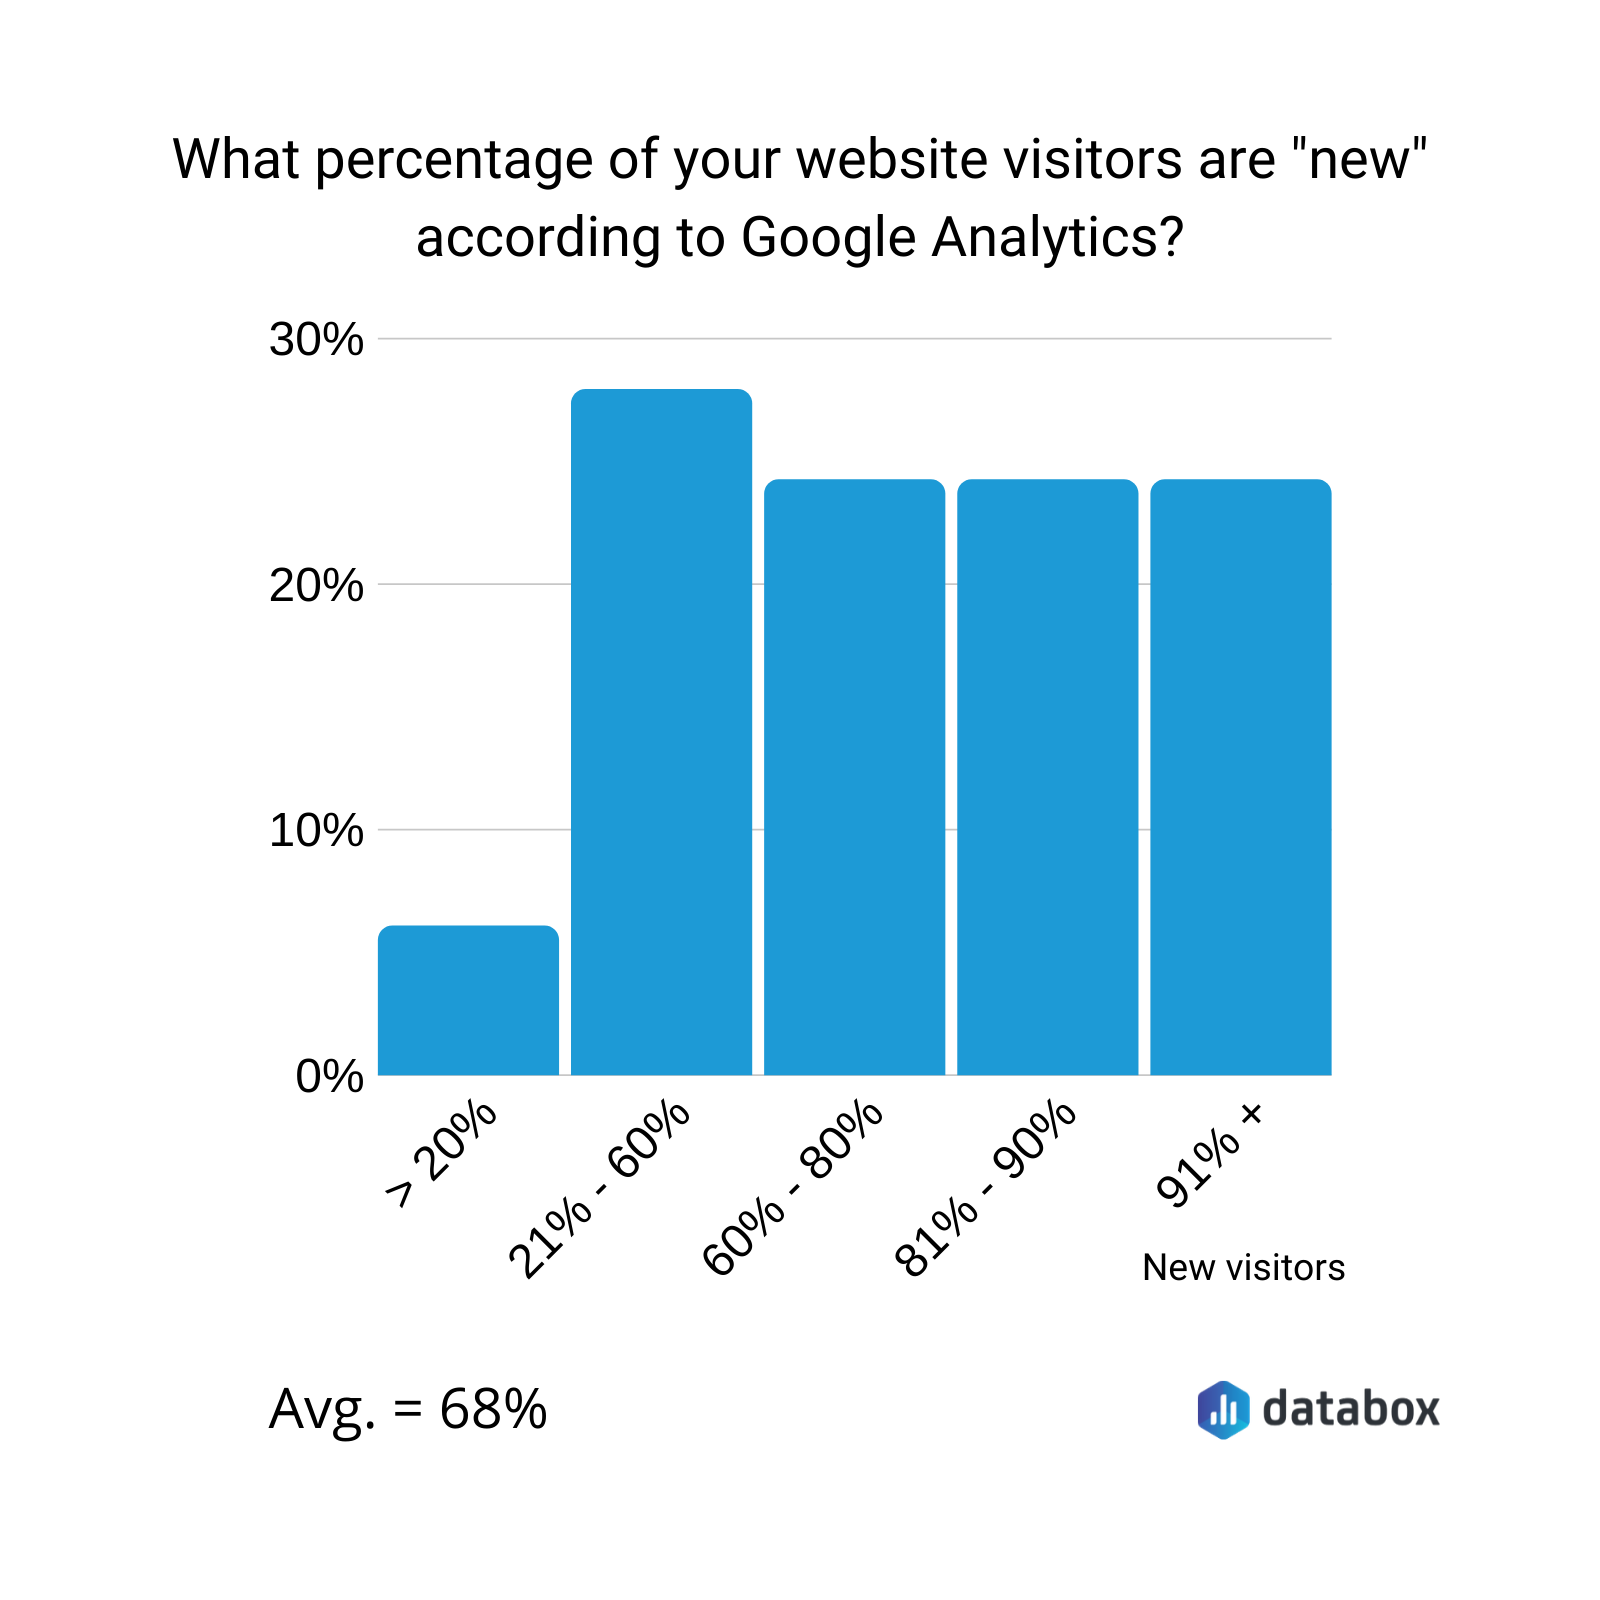
— Maybe my favorite interesting eCommerce stat. If you are Googling “on an ecom site what percentage of visitors return?” this is the metric you are looking for. Databox surveyed marketers and found that, on average, 68% of site visitors are new visitors (source). If you don’t convert the visitor on their first visit, you’ve lost 68% of them forever.
— According to Databox’s Benchmark data of 2000 companies, the average conversion rate for Google Ads is 2.85%. (Source).
— The average conversion rate for Facebook ads across all industries is 9.21%. (Source).
— How long do users stay on your website? Less than 15 seconds.
— 89% of beauty shoppers say they finish the purchase (AOV < $60) the same day they first see the product. (Source)
— This next stat is old (2005), but I have looked at dozens of newer sources, and either their data isn’t credible or they also eventually list back to the same 2005 report. So here goes: Half of all online purchases occur within 28 minutes of the initial click. 75% occur within 24 hours. (Source)
Even More Site Metric Stats
— According to a 2017 study by Baymard Institute, 57% of visitors who abandon their shopping cart do so because they are in research mode. To convert shoppers who are in research mode, use this tactic.
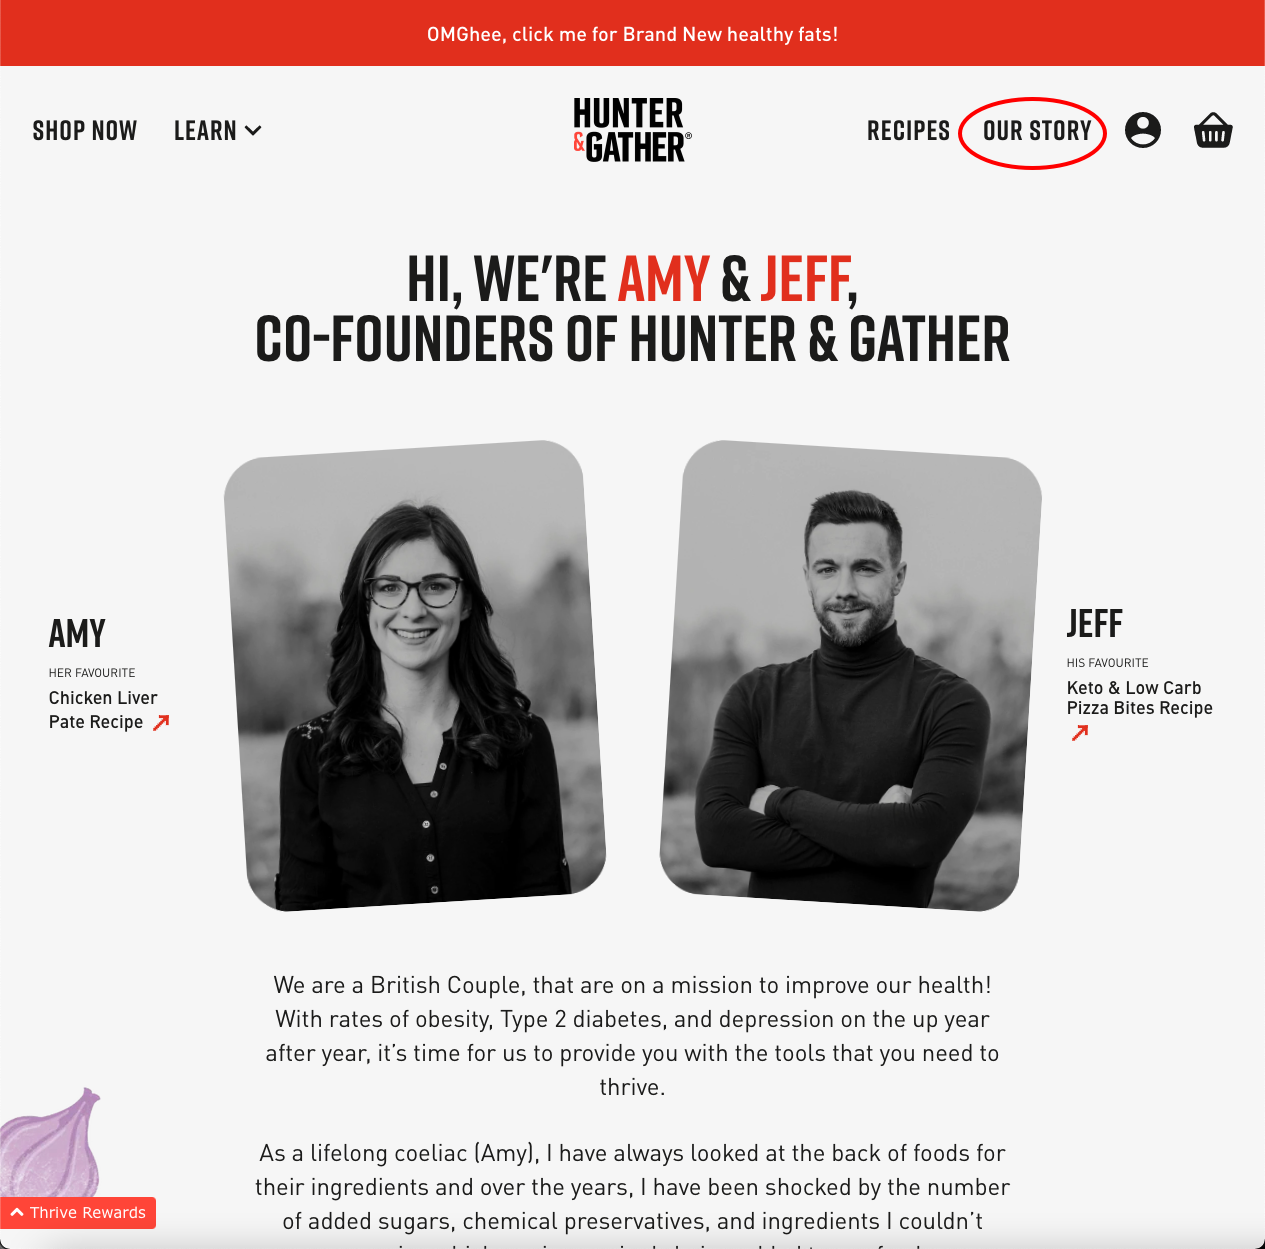
— 67% of users on DTC sites seek out non-product content. So give them more content like “About Us,” “Our Story,” and “Our Process.” (Source)
— 60% of online shoppers worldwide consider eCommerce pricing as their very first criterion affecting their buying decision. (Prisync data)
— According to Baymard Institute, 69.57% of online shopping carts are abandoned (source.)
— Your site visitors are incredibly distracted. According to Namogoo, the most common thing consumers are doing when they’re shopping online is— drumroll, please— office work. You are sadly mistaken if you think you have 100% of their attention you are sadly mistaken.
— Your “why we exist” story matters. KoMarketing did a survey where they asked “Once you’re on the homepage, what information do you want to see available?” 52% said About/Company Information (source). Start constructing your “why we exist” story.
— 58% of customers change brands from one purchase cycle to the next (source). This is both a threat and an opportunity to convert new buyers.
Bottom line: Taken together, what do the interesting eCommerce stats on-site metrics show you? Shoppers are more discerning. They’re more demanding. They’re less tolerant of sites that can’t provide the information they’re looking for. So make sure your site has that information!
Interesting Ecommerce Stats for the Product Page Sales Pitch
— Jellyfish studied the top 100 US retailers and found that 48% have incomplete or unhelpful product descriptions. Money on the table (source.)— 88% of customers think detailed product pages are crucial for purchasing (source.)
— 20% of all purchases are abandoned due to insufficient product information on the site (source). This is why questions before conversions are such an important concept.
— Unbounce.com analyzed 40,000 landing pages and found that the conversion impact of copy is 2x that of design. (source).
— The average American is considered to have a readability level equivalent to a 6th/8th grader (12 to 14 years old). And even if your audience has a higher educational level because people are multitasking and distracted, from a conversion perspective, it’s best to write at an 8th-grade level. This basic idea is confirmed in a Nielsen Norman Group article.
— Research by Hyunjin Song and Norbert Schwarz demonstrated that people estimate instructions to be twice as difficult to perform when written in a fancy, complicated font versus a simple font (source).
— The ideal desktop font size is 16 pixels (source). A ClickLaboratory.com test found increasing font size improved conversions by 133% (source). Learn more about font size and conversion rates here.

Since you're liking this listing of interesting eCom stats you're gonna love the conversion ideas I share in my weekly newsletter. Signup below. If it isn't as good as I'm making it sound unsubscribe with one click.
A/B Testing
– One in every 7 A/B tests is a winning test, which means more than 85% fail. Source.
Storytelling
— Stories are 22 times more memorable than facts & figures alone.
— Personal stories and gossip make up 65% of our conversations (source: The Secrets of Storytelling). So, why don’t more marketers use storytelling as a conversion tactic?
— Why do stories play such a big role in conversion optimization? As we’re digesting a story, our brain waves start synchronizing with the storyteller, says Uri Hasson, professor of psychology and neuroscience at Princeton University.
Video
– Did you know that after watching a product video, consumers are up to 85% more likely to buy it? (Source: Can Product Videos Increase Conversion Rates?).
Email Marketing
— We send a lot of emails. Over 102.6 trillion emails every year. And the numbers keep going up, with 126.7 trillion expected to be sent by 2022. The average email subscriber receives 13 commercial emails a day.
— 98.05% of visitors close a self-activated popup message (source).
— A few interesting e-commerce email stats from MailChimp:
- Average Open Rate = 15.68%
- Average Click Rate = 2.01%
(Source)
— Compared to traditional marketing efforts, email marketing is super cost-effective. Direct Marketing Association estimates that email marketing brings in $40 for every $1 spent.
Interesting Stats About Ecommerce Product Reviews
— What percentage of eCommerce buyers leave a product review? Well, we know YOTPO’s post-purchase review request email has an 8.1% conversion rate. The industry average is much lower. (Source)
— Up to 80% of reviews originate from follow-up emails urging shoppers to review their purchases (Power Reviews, 2017)
— 4.2-4.5 stars are the ideal star ratings to maximize product page conversions. Surprisingly, perfect 5-star reviews are considered too good to be true. (From Reviews to Revenue, PowerReviews & Northwestern University)
— 54.7% of consumers read at least four reviews before buying a product. (Source)
— Negative reviews have an 11% chance of changing purchase intent (and not in a good way). (Source)
— Going from zero reviews to one review with 4.2 stars or better improves conversion rates (sales) by 20 percent. (Source)
— PETCO.com found that products without reviews have a 20.4% higher return rate than those with reviews, and products with 50+ reviews have a return rate that is half of those with less than 5 reviews. (Bazaarvoice.com research)
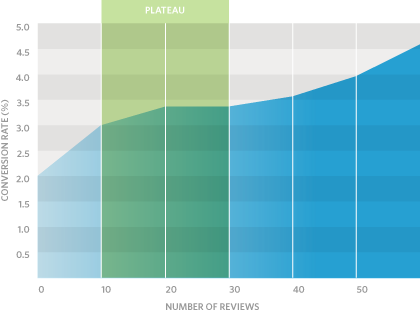
— Effect of product review count on conversion rates: the more reviews you add bigger the effect on conversion rates (Source)—
Investment in Conversion Rate Optimization (CRO)
— For every $92 marketers spend on driving traffic to their site, they spend $1 on converting that traffic. (Source)
— Users often leave web pages in 10–20 seconds. But, if you have a clear value proposition that entices them to stay half a minute, there’s a fair chance that they’ll stay much longer — often 2 minutes or more, which is an eternity on the web (source). You can achieve this by optimizing your landing pages.
— Only 17% of marketers use landing page A/B tests to improve conversion rates. (HubSpot, 2020).
— In 2019, advertisers spent $134.81 billion on Google (source). Up 15% from the previous year. This ad spend is fighting for the $20,000 in annual discretionary spending for American families making $78,635/year (U.S. Bureau of Labor Statistics).
All of us are competing over this $20,000 pie. Improve your success rate by using principles of buyer psychology.
— An American household earning an annual income of $78,635 spent about $20,000 on consumer goods in 2018, according to the U.S. Bureau of Labor Statistics in the most recently available data published on Sept. 10, 2019.
Interesting Stats About the Impact of Visuals on Ecommerce
— TechSmith found that 48% of people find video the most engaging form of communication (vs. just 15% who favor plain text).
— Visuals are processed 60,000x faster in the brain than text. (Source: Neo Mammalian Studios)
— Researchers W. Howard Levie and Richard Lentz analyzed 55 studies to determine the impact of visuals associated with the text. On average, visuals improved information synthesis by 36%. Are you using this conversion strategy? (source: Effects of text illustrations).
— After watching a product video, consumers are up to 85% more likely to buy it. (Source: Can Product Videos Increase Conversion Rates?).Buyer Psychology
— Researchers estimate that 40% to 50% of our daily actions are done out of habit (Source: Atomic Habits by James Clear).
Google Search
— 15% of Google searches done by users daily have never been seen before. (Source)
Interesting Mobile Ecommerce Stats
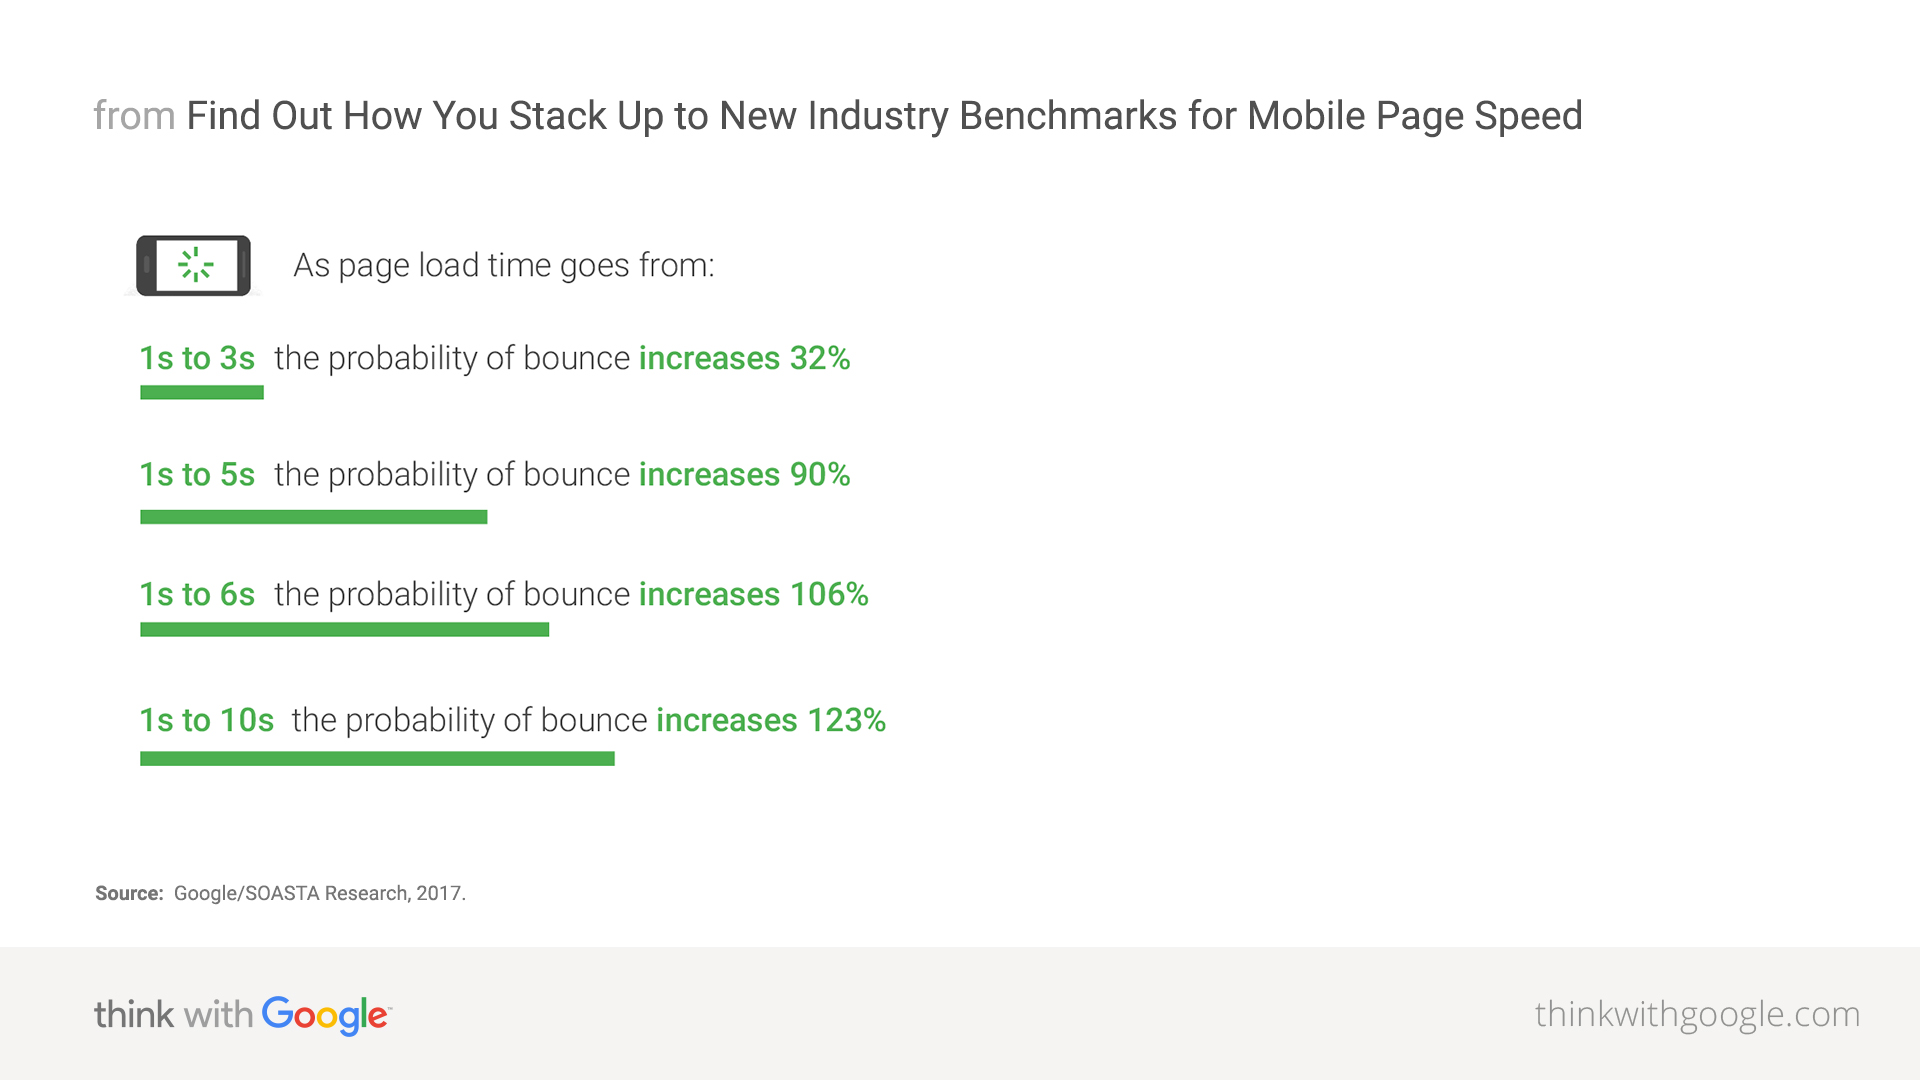
— If mobile page load time changes from 1 second to 3 seconds, bounce rates increase 32% (source):
Interesting Amazon Ecommerce Stats
— 55% of people in the U.S. now start their online shopping trips on Amazon.com. That’s a 25% increase from the same survey last year when 44% of online shoppers said they turned to Amazon first. (source: ReCode)
— Amazon was running 200+ tests a month in 2004. Today, the top players run thousands of tests. Intuit: 1,300, P&G: 7,000–10,000, Google: 7,000, Amazon: 1,976, and Netflix: 1,000
— Amazon Prime is used by over 50% of US households. To put this into perspective:
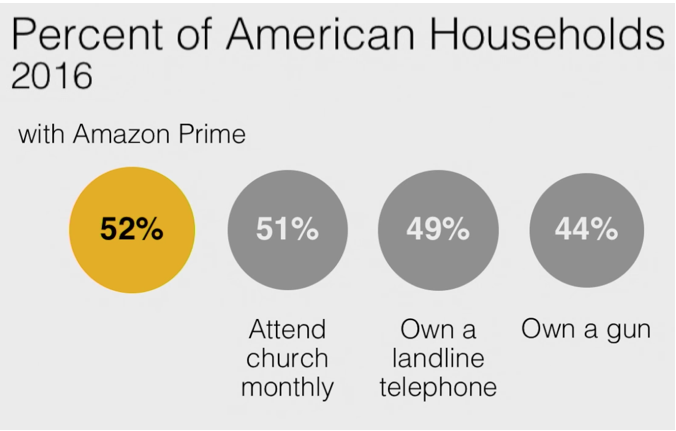
Source: @profgalloway
— In 2023, the conversion rate of advertisers on Amazon is 9.39% (source).
Live Chat
— According to ApexChat, live chat can increase online leads by an average of 40%. On top of that, chatbots can further increase sales 4x more than some human workers (source). So, as you can see, chat has a massive overall impact.
The Big Picture
eCommerce stats are a great starting point. But I know you are looking for a clear action plan. Good, that’s what I’m offering.
There are many ways to segment your audience, yet there is just one segment that matters.


Comments 4
Mannnn that’s crazy that the average time spent on a website is going down. And it’s pretty obvious that online purchases have not gone down recently.
Also… WOW… copy is 2x more impactful with conversions than design.
This was really helpful info, thank you for breaking it down Rishi! 🙏🏼
ReplyRishi Rawat
You’re most welcome, Tommy. Haven’t seen you here in a long time.
ReplyI always look forward to my Monday morning “coaching session” from Rishi — this one was packed full of info and insights…I need a few hours to digest it all. Thanks for keeping us educated.
ReplyRishi Rawat
Hi, Chip. Let’s not forget you’re running the world’s best spice store (Spiceology.com).
You may not know it but we’re learning a lot from your site 🙂
Reply